Student Loan Project Reflection
I feel that I learned some very important information in this project, the best thing I can take away from this project is that I will use this knowledge in the real world outside from high school. I really hope to do more projects like this in the future.
Linear Regression Data Project
Slack line City
Procedure:
1. I set up my slack line in between two trees and cranked the ratchet until there was enough friction to support itself.2. With a tape measure I measured the length of the slack line to find the exact center.
3. I pulled the ratchet by 1 click and stood up on my feet in the middle of the slackline.
4. While still balancing I used the tape measure to measure the height of the slack line from the ground where I was balancing.
5. I recorded the data into a table.
6. I repeated this 9 more times while cranking the ratchet one more click each time.
Predictions:
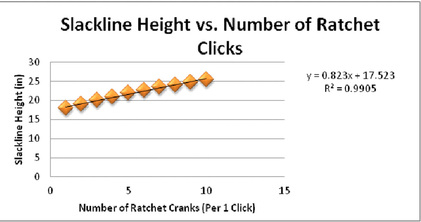
My predictions will be at 15 clicks and 20 clicks on the ratchet. I am predicting that will bring the height of the slack line (when I am standing in the middle) to about 29 inches and to about 32 inches. The slack line gains about 0.75 inches every one click on the ratchet and by extrapolating how much that will be including the r and r squared value which are at .98 and .97 I think the predictions are very accurate.
Reflection and Conclusion:
The regression equation clearly fits the Scatter Plot and the Data Table. It says that the data starts at 17.7 inches and it increases 0.8 inches every 1 click on the ratchet. The slope of the regression equation matches perfectly with Data Table and the Scatter Plot explaining how much and in what area the data values increase. The y-intercept of the equation also matches up perfectly with the Scatter Plot and the Data Table and it explains exactly where the data starts when the x value is zero.
[email protected]
Animas High School 20091 Hwy 160 Durango, CO 81301
(970)-247-2474
